Insights (decoded intelligence)
Field analysis, market data, and our experts' insights on these topics across banking, retail, logistics, and the public sector.

Article
Data Engineering
Software Security
11 min read
Student records are among the most sensitive data any institution holds, and the easiest to underprice. What a school breach really costs, and where to start
04 Jun 2026

Article
IT Consulting
7 min read
The technical debt of the system you built for your school eats 40% of IT budgets at scale, and callback delays cut trial conversion by 50%+. Fix the structure before adding more tools.
14 May 2026

Article
Regulatory & Compliance Advisory
Data Analytics & AI
11 min read
Legacy administrative platforms across European education institutions were procured separately with no shared architecture, creating education data silos that force daily manual reconciliation, while 70% of IT capacity is consumed maintaining these systems.
02 Mar 2026

Article
IT Consulting
Regulatory & Compliance Advisory
12 min read
Over 70% of European universities use a variety of digital systems that don't work well together. It's more important to think about how to integrate and govern the system than to choose the software. Here's why.
19 Feb 2026
Article
Regulatory & Compliance Advisory
Finance & Banking
11 min read
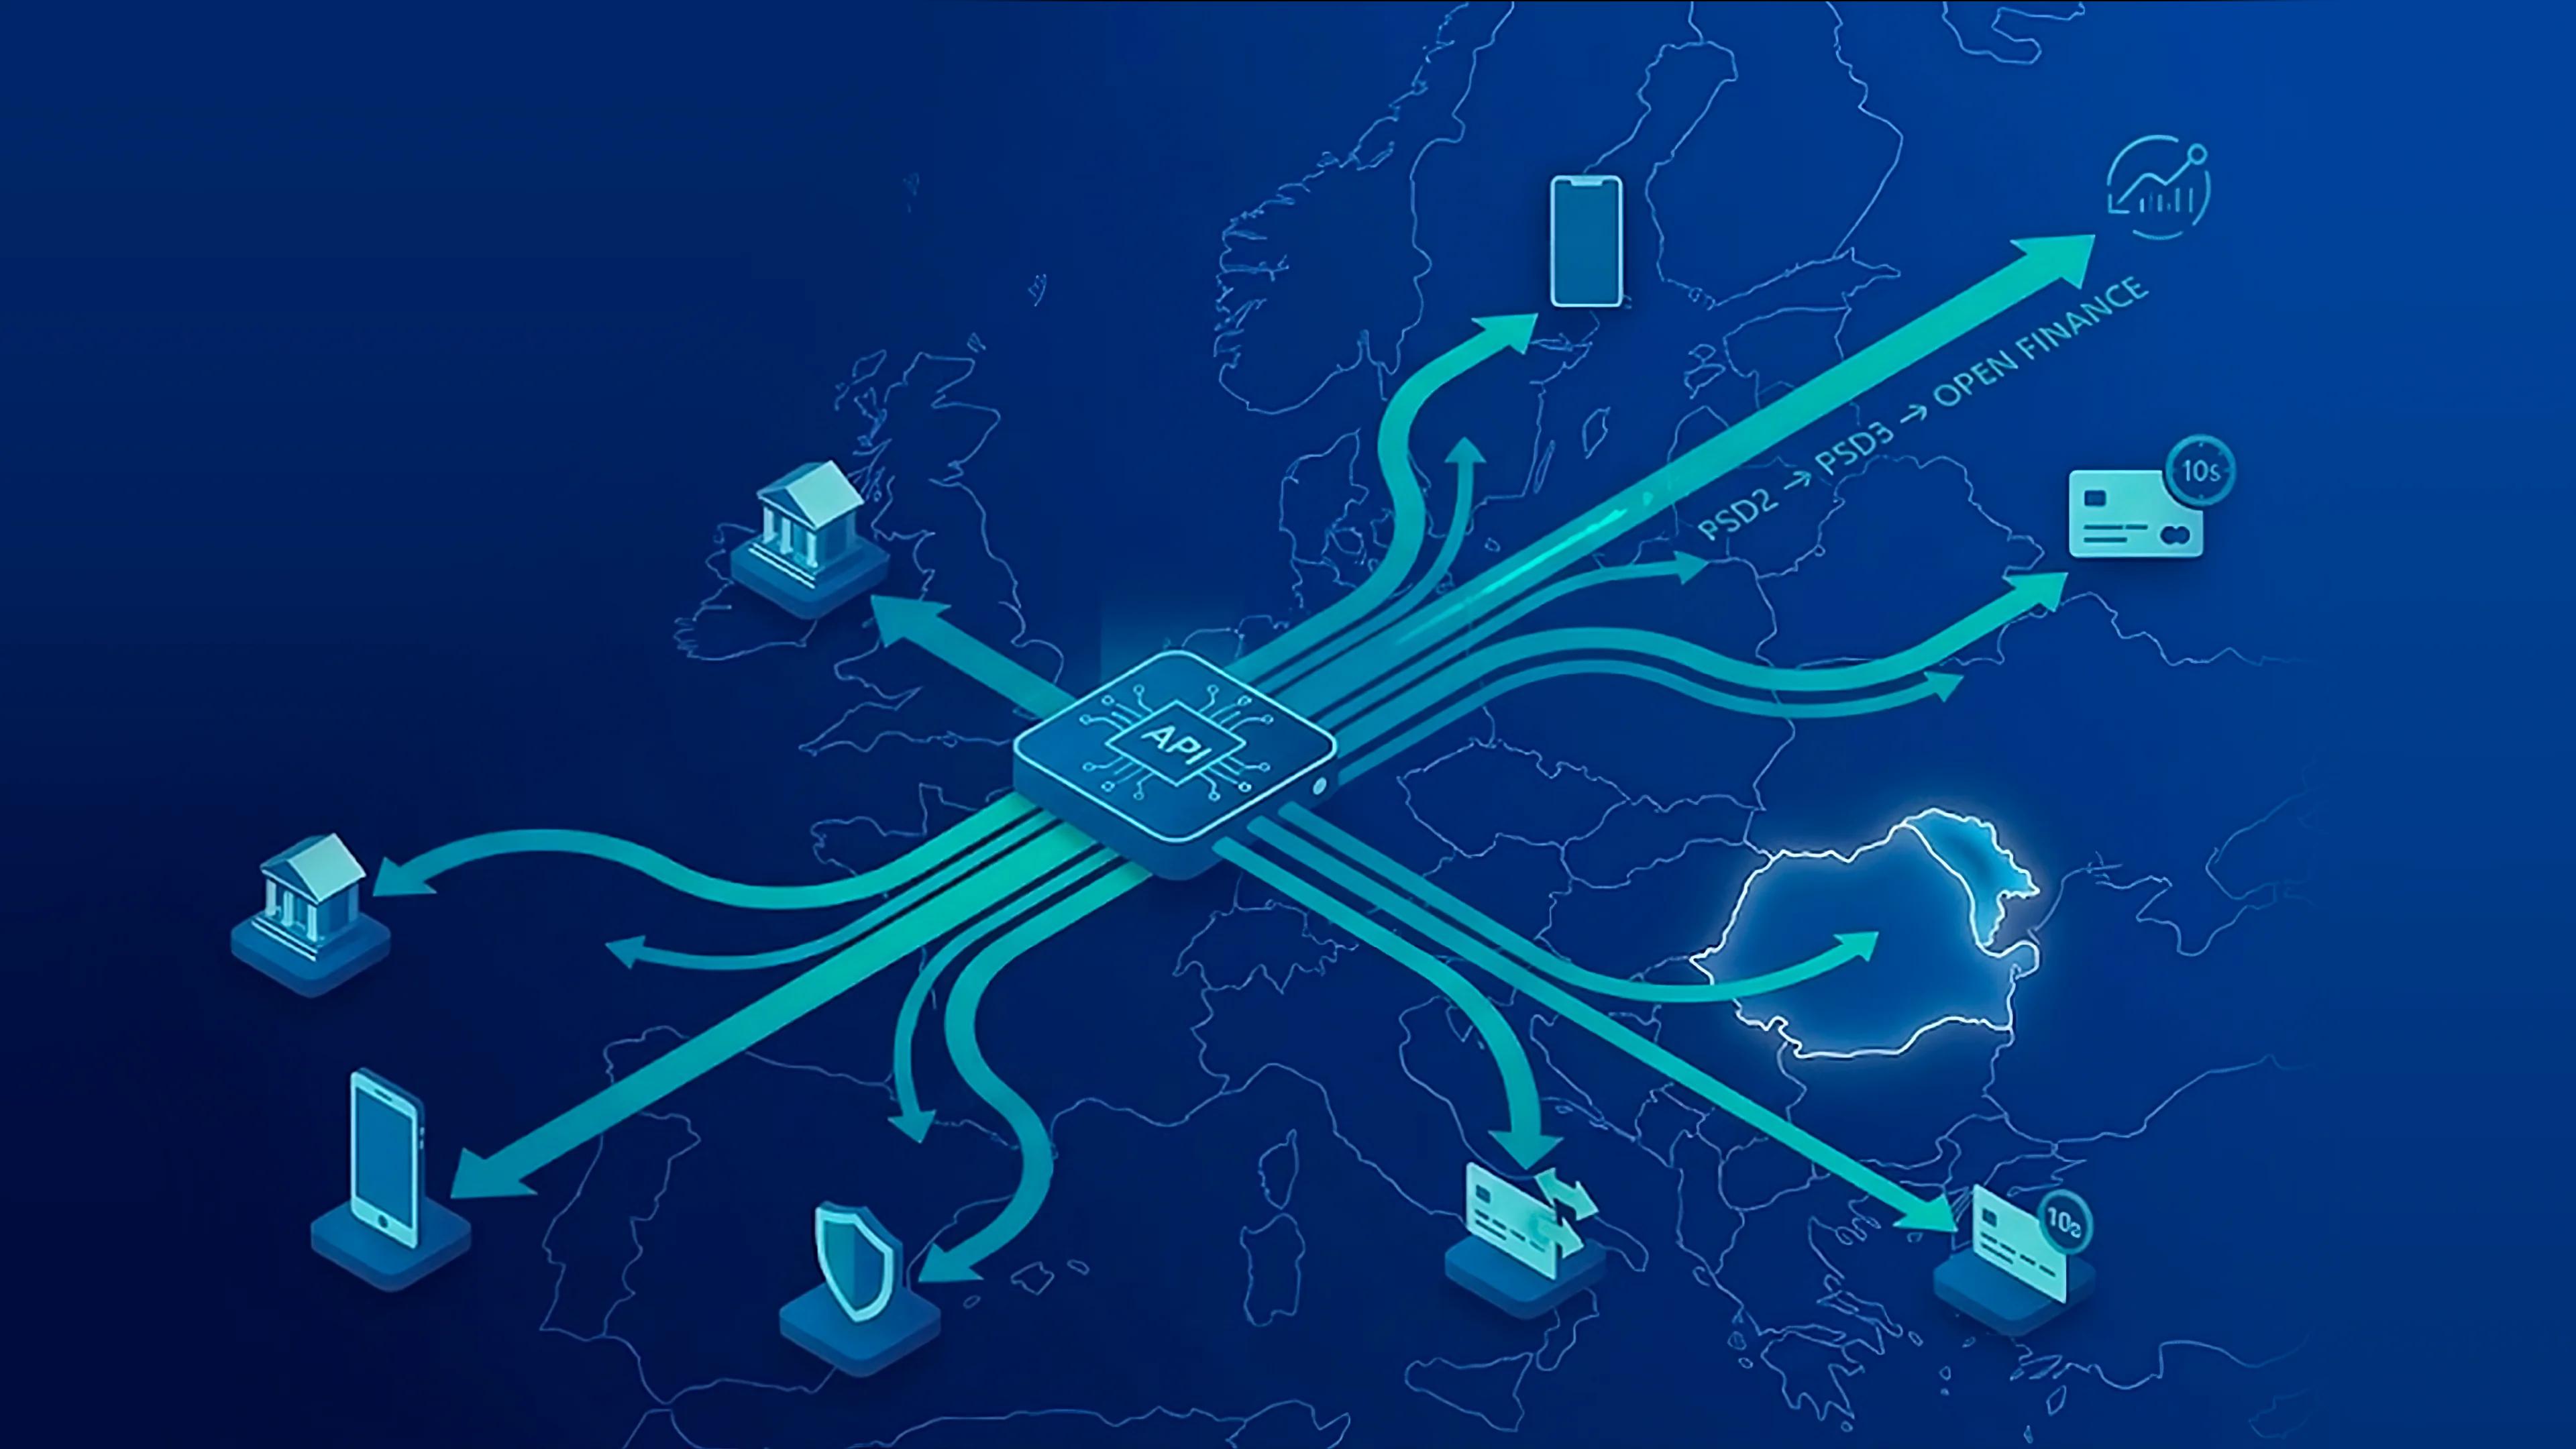
How Open Banking works after PSD2 and what the API economy means for banks, instant payments, and system architecture in Europe.
18 Dec 2025

Article
Regulatory & Compliance Advisory
Business Strategy & Growth
8 min read
Learn what an eCommerce audit includes and why EU-linked retailers need it in 2025. Covers security, PCI DSS, ISO 27001, SCA, fraud risk, and business continuity.
01 Dec 2025

Article
Technology Strategy
Retail & Consumer Goods
9 min read
TikTok and Instagram now drive product discovery across the EU. See how social commerce is replacing search, and insights into MD/RO market for brands to convert with a strong infrastructure.
01 Dec 2025

Article
Finance & Banking
Digital Transformation
10 min read
Banking process automation enables financial institutions to replace manual approvals with low-code workflows that integrate payments, lending, and compliance in real-time. It ensures PSD2 and KYC/AML compliance while enabling instant payments, such as SEPA Instant and Moldova's IPS, for faster and safer banking.
11 Nov 2025

Article
DevOps
Cloud Computing
Digital Transformation
5 min read
From banking to public services, systems don’t fail because of bad code—they fail because of bad delivery. This article shows how EBS Integrator uses DevOps to make deployments predictable, recover in minutes, and scale without chaos. Includes real case studies, expert insights, and a look at the next wave of DevOps—AI, serverless, edge computing, and hybrid cloud.
08 Aug 2025
Article
Business Strategy & Growth
Regulatory & Compliance Advisory
5 min read
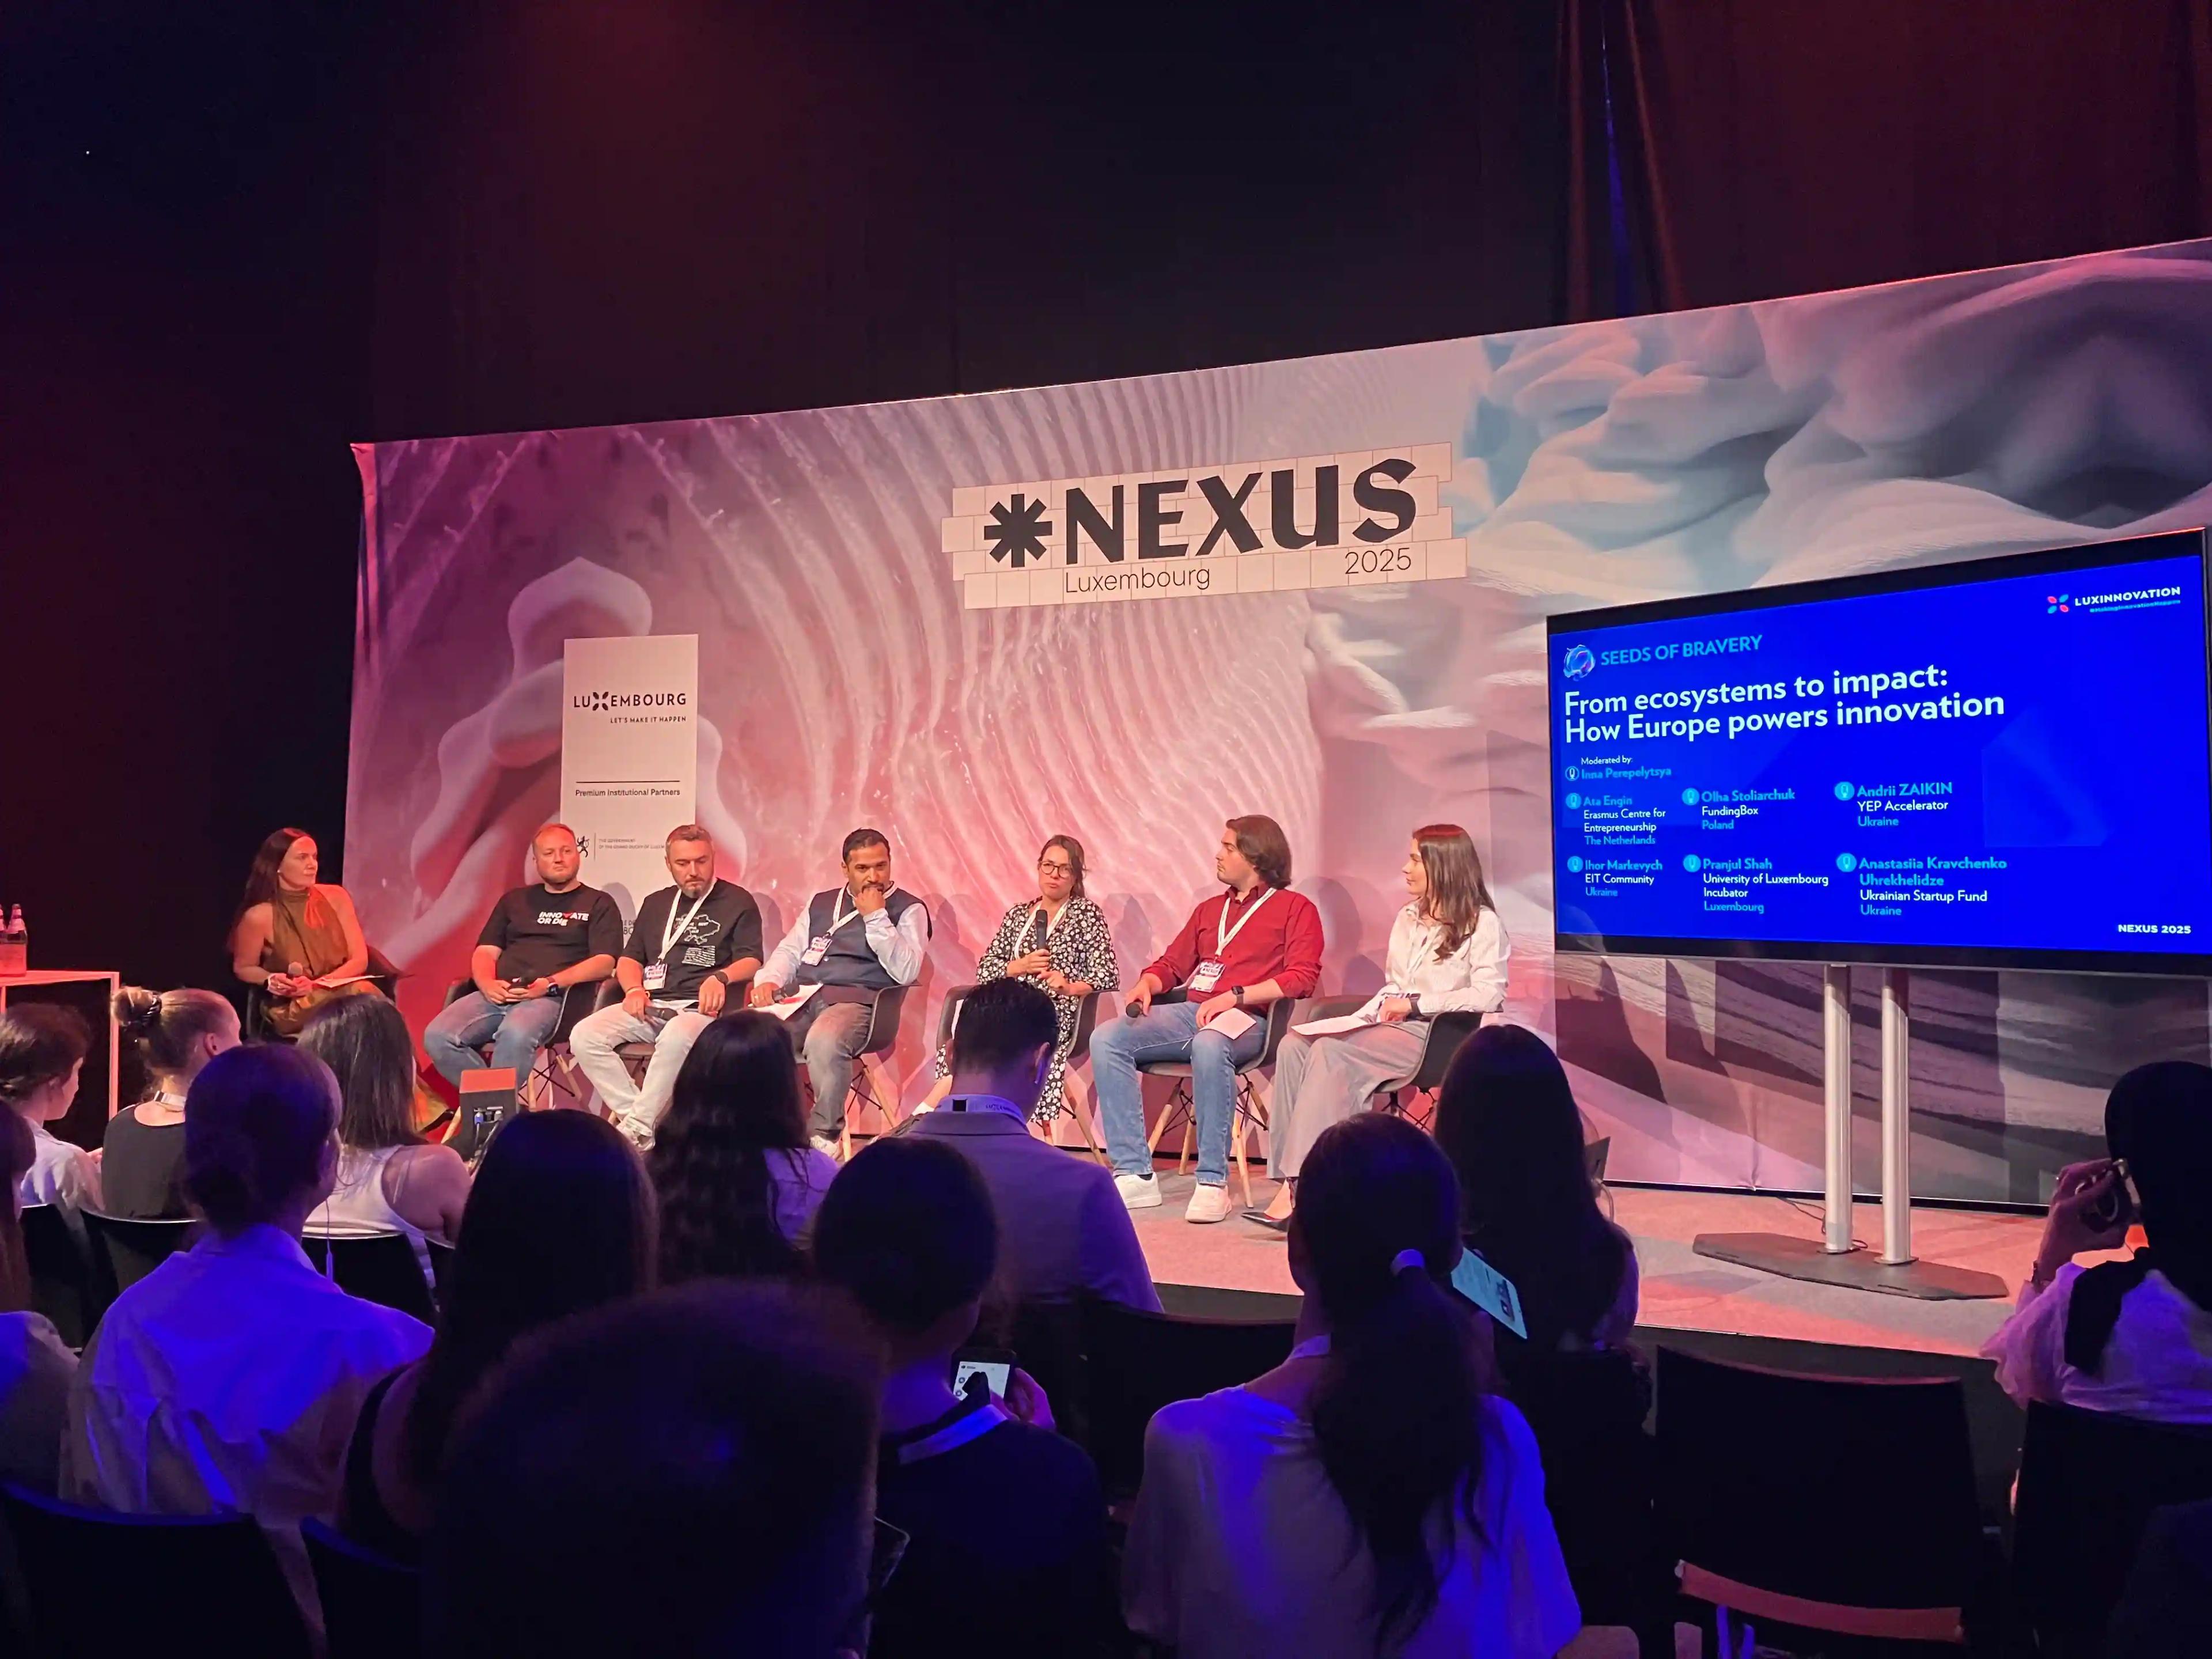
Everyone knows Romania and Moldova for good code at low cost. At Nexus 2025, they showed something else: strategic value at the system level.
28 Jul 2025

Article
IT Consulting
Business Analysis
Digital Transformation
6 min read
Learn how consulting has changed—and why it works better than traditional approaches. *Real examples from our porfolio included - showing how it solves problems others couldn’t.
22 Apr 2025

Article
Data Engineering
Retail & Consumer Goods
7 min read
Discover how Augmented Reality (AR) is transforming retail by allowing customers to try products before they buy. Learn how AR enhances customer experience, reduces returns, and increases sales for businesses.
07 Feb 2025

Article
Data Engineering
Retail & Consumer Goods
6 min read
Find out how technology-driven personalization x AI creates closer relationships with customers.
07 Feb 2025

Article
Business Strategy & Growth
Data Analytics & AI
Technology Strategy
6 min read
Discover how omnichannel strategies and AI-driven personalization help retailers connect online and in-store experiences, improve operations, and keep shoppers coming back.
07 Feb 2025

Article
Retail & Consumer Goods
Data Analytics & AI
Business Strategy & Growth
6 min read
Reach customers wherever they shop with AI and real-time data. Discover how targeted marketing, a seamless online and offline shopping experience, and predictive analytics can personalize recommendations and boost sales. Our retail expert, Olga, shares practical insights and strategies to help you take your store digital. Read the full article for actionable tips and real-world examples.
24 Jan 2025

Article
Digital Transformation
Business Strategy & Growth
8 min read
Many see digital transformation as a quick fix for outdated systems, but it’s much more than that. It’s about building smarter, stronger ways of working—operationally, technically, and culturally. This means ensuring teams not only use new technology but understand its purpose and value. Our CEO, Vitalie Aremescu, and Business Analysis Manager, Natalia Ciobanu, share their expertise in helping businesses adapt and thrive in today’s market.
20 Dec 2024

Article
Data Engineering
Retail & Consumer Goods
8 min read
Discover how Big Data is changing the retail industry with insights from experts Mariana Dicusari and Iulian Ciobanu. Learn how businesses use data to make smarter decisions, create personalized experiences, and improve customer service with real examples of how Big Data helps retailers stay ahead in today’s fast-moving market.
06 Dec 2024

Article
Retail & Consumer Goods
AR/VR
Digital Transformation
7 min read
Discover how businesses are transforming sales strategies in the era of modern commerce with Olga Petrascu, expert with 8 years in Retail & HoReCa. Learn about personalized customer experiences, data-driven decision-making, omnichannel approaches, AI/AR and real stories of how we help businesses implement new business models.
22 Nov 2024

Article
Cloud Computing
DevOps
Data Analytics & AI
9 min read
Data storage has evolved from paper/floppy disks to cloud tech. See through our experts' experience what cloud migration is, how can you use it for your business and what you get from migrating your data to the cloud.
08 Nov 2024

Article
Mobile App Development
Business Strategy & Growth
Programming Languages
8 min read
See how mobile apps can boost your business growth. Some remain unaware or have tried without success, but our tech leads in iOS & Flutter prove that modern app development truly works.
23 Oct 2024

Article
Digital Transformation
Business Strategy & Growth
News
6 min read
EBS Integrator evolved naturally, driven by a deeper impulse to adapt and grow. CEO Vitalie Aremescu founded the company in response to this fundamental sense of evolution. "I realised that I needed to evolve," Aremescu shares in an interview with Wall-Street.ro. Today, that same impulse continues to run a company that not only provides technology expertise, but also teaches others the importance of evolving in an ever-changing environment.
30 Sep 2024
Article
Software Development
Agile Project Management
12 min read
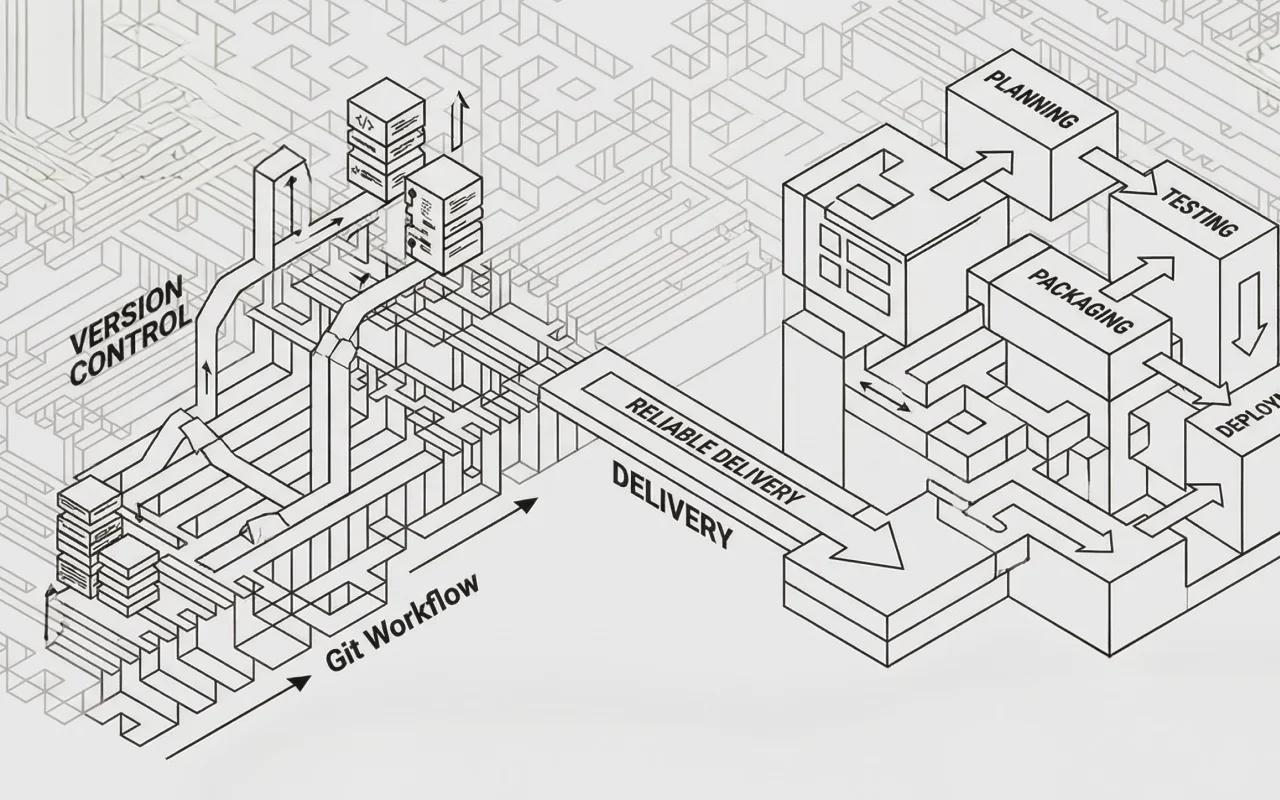
Explore the key benefits of using version control and release mangement in software development, emphasizing its role in preventing data loss, enhancing collaboration, and improving product quality. See the different types of version control systems and find advice on implementing them effectively. Learn how you can use it for streamlined and successful software projects.
29 Mar 2024
Article
Technology
News
Innovation
6 min read
2023 was a year of major technological advances around the world that not only offered hope for a better future but began to make it a reality. Technology has advanced significantly in areas such as AI, quantum computing, AR/VR and environmental technology.
27 Feb 2024

Article
Programming Languages
8 min read
Explore programming history from the 1950s-60s. Discover FORTRAN, LISP, COBOL, and BASIC—the languages that shaped modern coding. Part II of our series.
01 Feb 2024

Article
Data Analytics & AI
Software Security
8 min read
We’re talking about data privacy in all its glory – why it matters to you and your customers, and where it’s all heading in the future. Because this is a part of a series, we’ll try and focus mostly on the aspects that affect us in the eCommerce domain! Let’s discuss why there’s so much hubbub around the topic of data privacy. This is not to say this discussion is anything new for the world, it’s been brought up countless of times, and the issue of “government spying” on you is as old as the idea of structured government is.
18 Feb 2022

Article
Programming Languages
Software Development
7 min read
The world of Data Sciences’ is an ever-changing place, new applications and requirements appear on a daily basis. With all that, a professional SQL-guru who can optimize their interactions with databases is valued in his weight in gold. Luckily for us we have just such master. In this post we hope to explore the world of ORMs (particularely Django ORM vs SQL Alchemy) with our Python specialist and get his opinion on which he prefers! And provide some nifty examples to boot.
08 Mar 2021

Article
Data engineering
Data Analytics
7 min read
Peeling this BASICs digital onion, we’ve left some details out (particularly in our last article). As stated, data-centric and data-driven applications deserve their series, a journey we’re kicking off today. Before talking about BigData, strategies and mechanics, let’s filter the messy data-centric vs data-driven dilemma.
24 Aug 2020

Article
Data engineering
AR/VR
7 min read
2018 is becoming quite promising for augmented reality (AR) and this goes way beyond Pokemon Go. AR is changing the world of consumer marketing. It empowers stakeholders and clients to experience products and services as “prescribed”. It acts as “a sibling” to Virtual Reality platforms aiding physical reality with virtual objects. This way AR is delivering a new, interactive customer experience. Unlike other hypes we’ve seen rising, this tech is here to stay with figures expected to reach $117.4 billion by 2022.
12 Feb 2018